
Most e-commerce founders chase revenue. Few understand profit.
Revenue feels exciting — it signals growth, traction, momentum. But if your income statement isn’t structured, you’re scaling with blind spots. You don’t know where your margins are leaking, which platforms are hurting your bottom line, or whether your growth is even sustainable.
In this breakdown, we walk through a real 3-year transformation:
From $4K in net profit to nearly $48K — powered not by more sales, but by clarity.
This is the power of a structured SOPL (Statement of Profit & Loss). Not just numbers — but insights that help you scale profitably.
If you’re running an online store, this might be the most important system you implement this year.
Here’s What a Structured SOPL Looks Like
Before diving into specific strategies, here's a full view of the income statement we’ll be working with — pulled from a real e-commerce store scaling from $90K in sales (2022) to nearly $400K (2024).
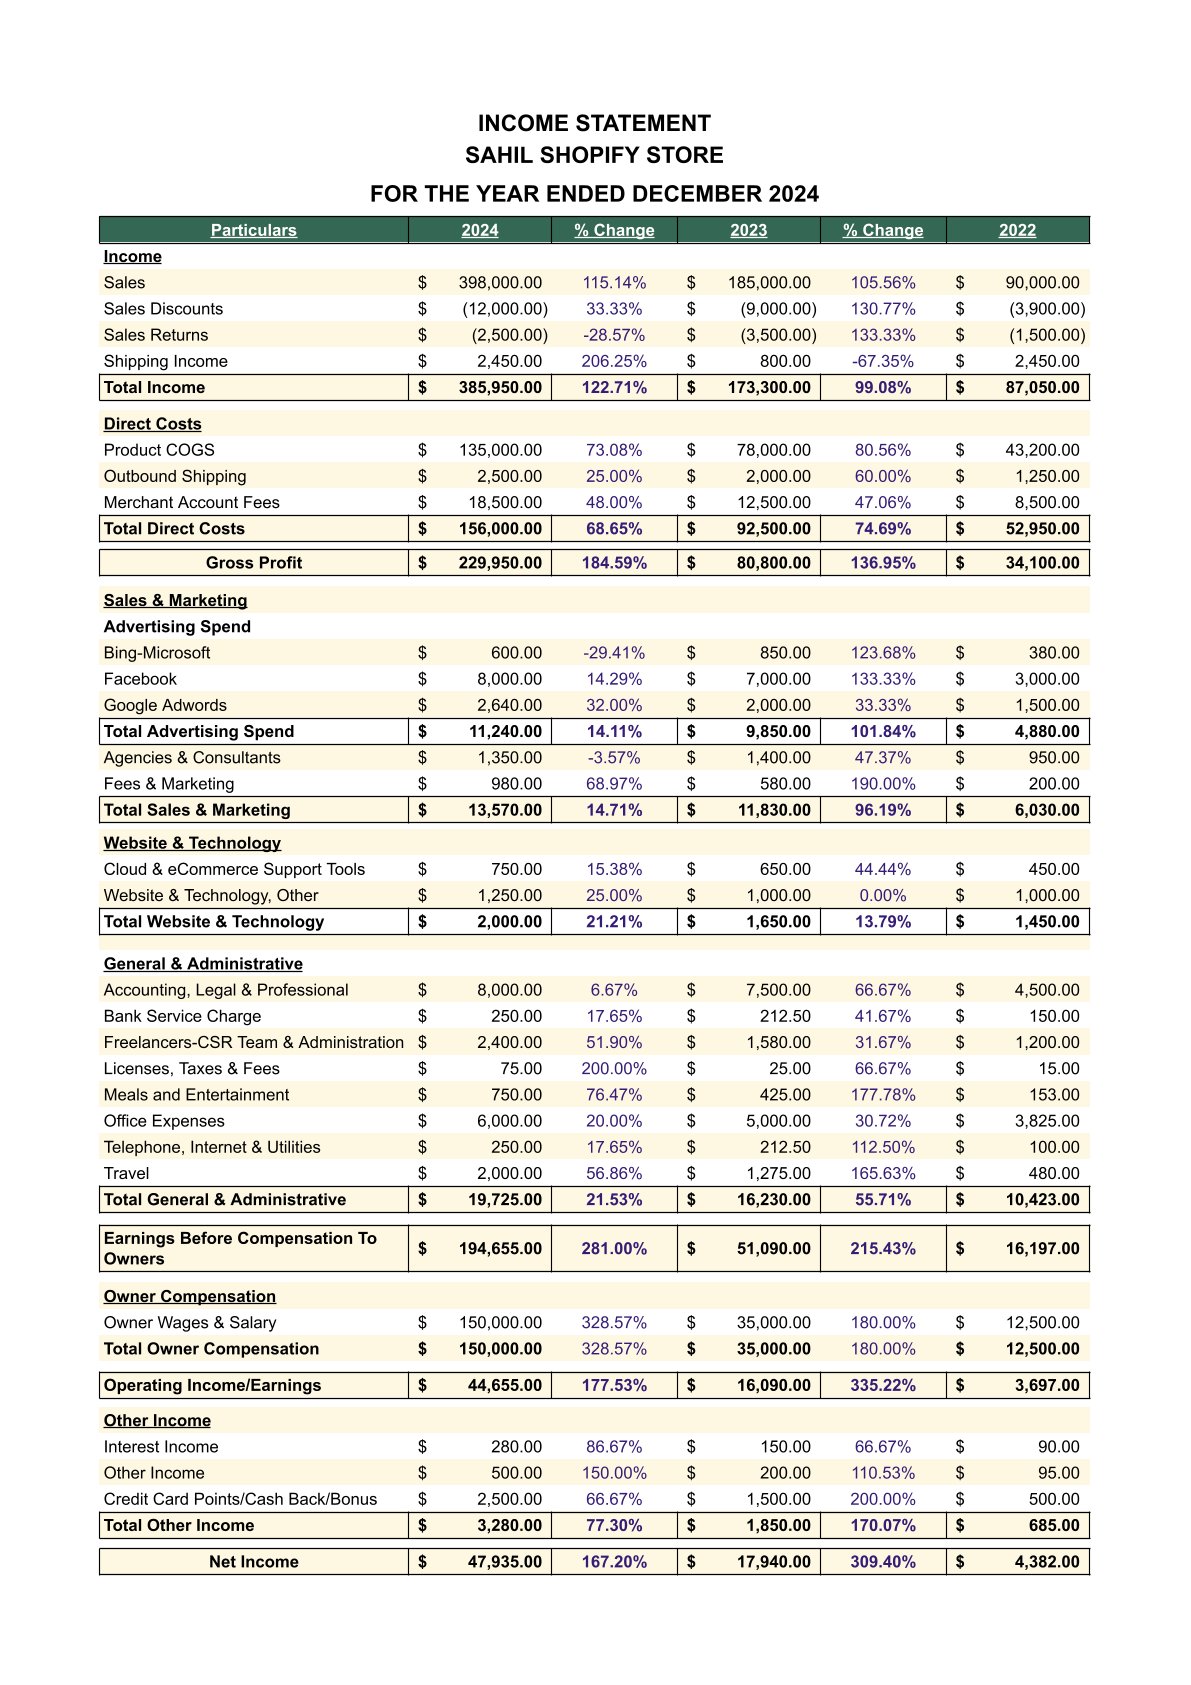
Every e-commerce Income Statement — also called a Statement of Profit & Loss (SOPL) — is built from a few core sections. Here’s a quick breakdown of what each one tracks and why it matters.
1. Income - Tracks all revenue sources — sales, shipping income, and deducts discounts and returns to reflect real revenue.
2. Direct Costs - Includes Cost of Goods Sold (COGS), merchant fees, and outbound shipping — these directly affect your gross profit.
3. Gross Profit - Revenue minus direct costs — your first clear signal of how efficiently you’re selling.
4. Sales & Marketing Expenses - All ad platform spends, agency fees, and promotional costs — the true cost of acquiring customers.
5. Website & Technology - Ongoing spend on e-commerce tools, analytics, hosting, and subscriptions that support backend operations.
6. General & Administrative (G&A) - Covers legal, accounting, freelancers, admin, travel, and office costs — all necessary to run the business.
7. Owner Compensation - What the founder or owner pays themselves — crucial to factor in to understand true profitability.
8. Other Income - Cashbacks, interest, and any income not tied directly to core operations.
9. Net Income - What’s left at the end — the actual profit after every dollar in and out has been accounted for.
Note: While the structure is real, certain names and numbers have been changed to protect client privacy and highlight the power of structured reporting.
Now let's dive in
Revenue
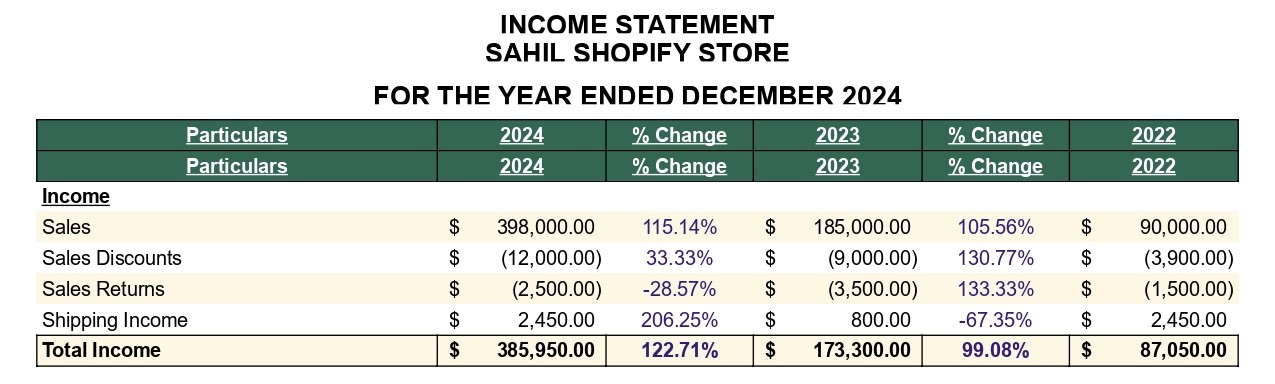
Sales Growth Over 3 Years: Sales more than quadrupled in 3 years, but did profitability follow?
Reality Check: Revenue ≠ Profit!
- 2023: Discounting (-$9K) & returns (-$3.5K) significantly reduced real revenue. Sales grew, but profit margins shrank due to uncontrolled pricing & refunds.
- 2024: Higher total revenue ($398K) + controlled discounting (-$12K) = More profit retained!
Without an SOPL, this insight would be missed!
Key Takeaways for E-Commerce Founders:
- Don't just track revenue—analyze net sales after discounts & returns.
- Your SOPL should separate platform-specific sales (Shopify, Amazon, etc.) to track performance by channel.
- Look beyond revenue! Track how much actually turns into profit after costs.
Lesson: Revenue growth is a vanity metric. Without a structured SOPL, you're flying blind on profitability!
Direct Costs
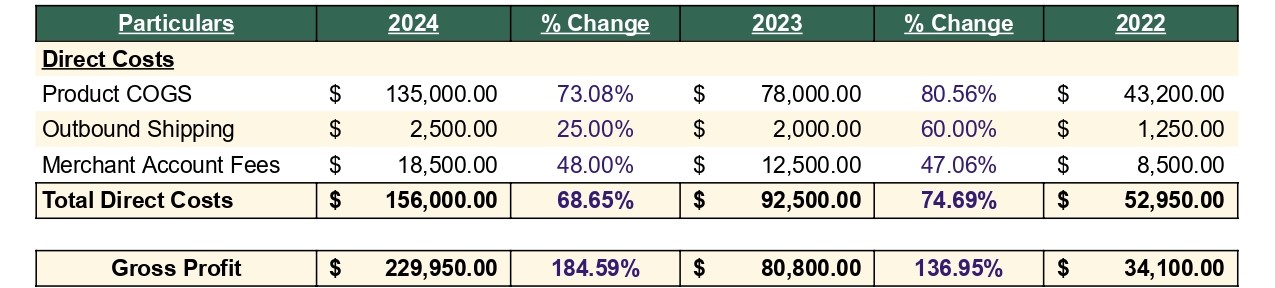
Direct Costs – A Hidden Profit Killer:
Cost of Goods Sold (COGS) Increased Sharply Over 3 Years:
2022 → $43,200 → 2023 → $78,000 (+80.56%) → 2024 → $135,000 (+73.08%)
Total 2-Year COGS Growth: +212.5%
But here’s the bigger picture: Revenue growth (2022 → 2024): $87,050 → $385,950 (+343.44%)
COGS growth (2022 → 2024): $43,200 → $135,000 (+212.5%)
While revenue grew at +343%, COGS still increased at +212%, meaning cost control is partially optimized but still has inefficiencies.
Key Red Flags:
- Product COGS is rising almost as fast as revenue—meaning gross margins are not improving significantly. Can supplier pricing be renegotiated?
- Merchant fees surged from $8,500 to $18,500 (+117%)—Are payment processing fees optimized? Are lower-cost alternatives available?
- Outbound shipping jumped +60% in 2023, then stabilized at +25% in 2024. This suggests some improvements in logistics but room for further cost efficiency.
What Founders Should Do: Negotiate better supplier terms: Bulk purchasing, alternative vendors, or reducing packaging costs.
Optimize fulfillment costs: Switching shipping providers, negotiating volume-based discounts, or using fulfillment centers.
Reassess payment processing fees: Are Stripe, PayPal, or Shopify Payments charging too much? Can lower-cost alternatives be explored?
Lesson: Growth Without Cost Control is a Profitability Trap. Many e-commerce founders celebrate revenue growth but ignore the fact that rising costs quietly kill margins.
COGS & merchant fees must be actively managed to ensure long-term profitability.
Marketing & Advertising – Smart Scaling or Overspending?
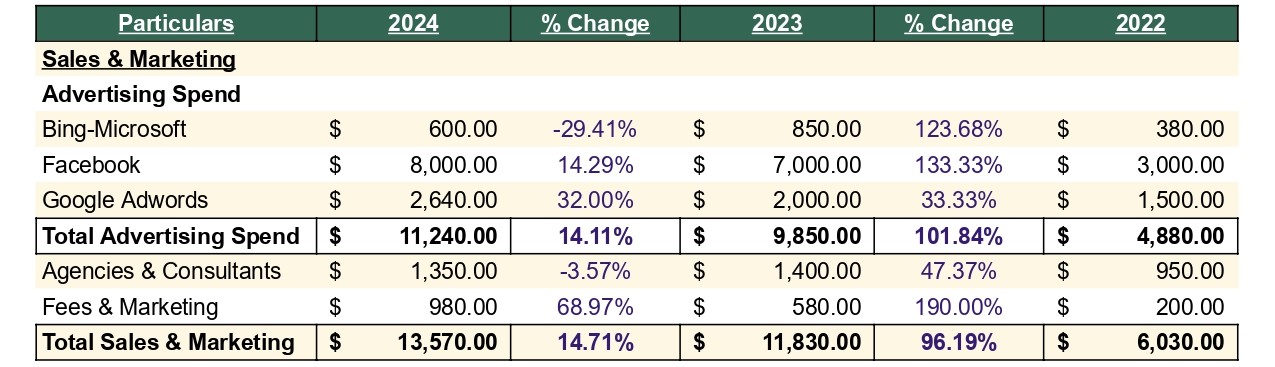
Ad Spend Trends Over 3 Years:
2022 → $6,030 → 2023 → $11,830 (+96.19%) → 2024 → $13,570 (+14.71%)
2023: Massive increase (+96%) to drive rapid growth.
2024: Controlled increase (+14.71%), suggesting a shift towards efficiency.
Key SOPL Insights: Marketing spend nearly doubled in 2023, but revenue also scaled massively—this was an aggressive customer acquisition phase. 2024 saw a smaller increase, meaning the brand is now focusing on profitability, not just raw growth. The question: Are these marketing dollars generating sustainable revenue, or are they just covering rising costs?
What Changed?
Bing Ads Cut (-29%) → Poor ROI → Reallocated budget to better-performing platforms.
Facebook Ads Growth (+14%) → After a huge 133% jump in 2023, spending stabilized. This suggests optimization rather than overspending.
Google Ads Investment (+32%) → Consistent spend → Long-term acquisition strategy.
Fees & Marketing (+69%) → Increased spending beyond ads, likely on SEO, partnerships, or organic growth initiatives.
Agencies (-3.57%) → Shift towards in-house marketing? Cutting external agency costs to boost margins.
Actionable Takeaways:
- Did your ad spend directly increase profits, or just revenue? Track profitability, not just top-line sales.
- Optimize ad spend per platform—cut underperforming channels like Bing, double down on high-ROI sources like Facebook & Google.
- Balance paid vs. organic growth—heavy reliance on ads is risky. Investing in SEO, content, and partnerships lowers long-term customer acquisition costs.
Lesson: Scaling Smart vs. Scaling Fast
- 2023: Growth at all costs → Revenue skyrocketed, but at what expense?
- 2024: Smarter scaling → Spending more efficiently while sustaining growth.
Marketing isn’t just about spending - it’s about profitability. If your SOPL isn’t showing a strong return on ad spend, you’re burning cash.
Tech & Infrastructure – The Long-Term Investment
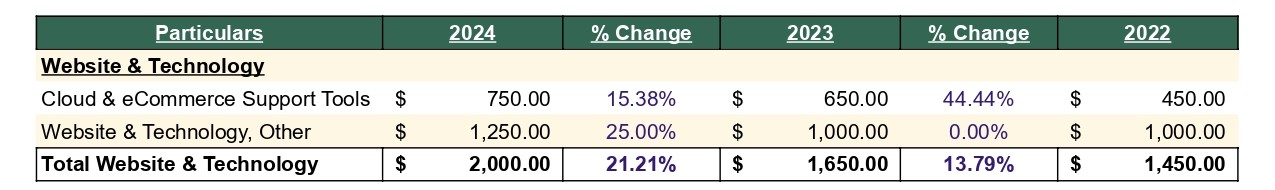
Spending Trends Over 3 Years:
Cloud & E-Commerce Tools: 2022 → $450 → 2023 → $650 (+44%) → 2024 → $750 (+15%)
Website & Technology (Other): 2022 → $1,000 → 2023 → $1,000 (0%) → 2024 → $1,250 (+25%)
Total Tech Spending: $1,450 → $1,650 (+13.79%) → $2,000 (+21.21%)
Key Insights:
Spending on backend tech is gradually increasing, suggesting the business is investing in better automation and efficiency tools.
No sudden spikes—tech investments are controlled, ensuring cost discipline.
Tech spending aligns with revenue growth, meaning these are likely necessary investments rather than wasteful spending.
What Changed?
Cloud Tools Spending Increased Steadily → Likely new software subscriptions or upgrades to support scaling operations.
Website & Tech Jumped 25% in 2024 → Could be investments in better hosting, site speed improvements, or advanced analytics tools.
No Drastic Over-Spending → Business is avoiding unnecessary software bloat, which often leads to wasted resources.
Best Tech Tools for E-Commerce Accounting:
A2X → Automates Shopify & Amazon bookkeeping.
TaxJar / Avalara → Simplifies sales tax compliance.
Gusto / Deel → Streamlines payroll for e-commerce teams.
Actionable Takeaways:
Is your tech stack actually improving efficiency? Track time saved & performance improvements after investing in tools.
Balance spending between necessary automation & avoidable software bloat.
If revenue is growing but tech spending is too high, review whether you’re paying for unused tools.
Lesson: Tech Should Scale With You—Not Drain You!
📉 Spending too little = Falling behind competitors in automation.
📈 Spending too much = Tool overload & wasted cash.
General & Administrative – Balancing Growth & Costs
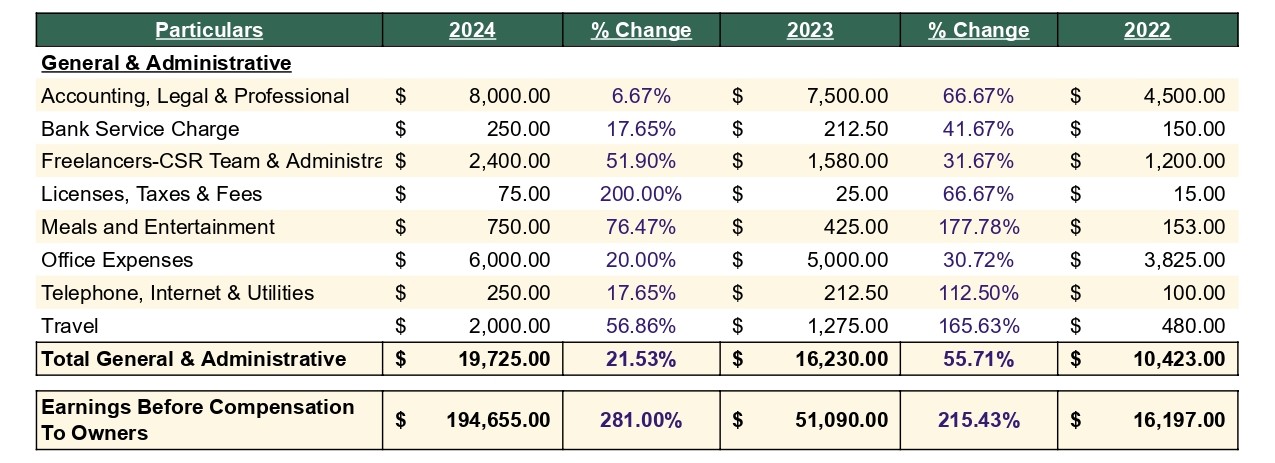
Spending Trends Over 3 Years:
2022 → $10,423 → 2023 → $16,230 (+55%) → 2024 → $19,725 (+21%)
Key Cost Drivers: Compliance, freelancers, admin support & business expansion.
Key Insights:
2023: Sharp increase (+55%) in G&A expenses—indicating investment in compliance, legal setup, and scaling backend operations.
2024: More controlled increase (+21%)—suggesting cost efficiency improvements and process optimization.
If G&A costs grow faster than revenue, profitability is at risk!
What Changed?
Accounting & Legal Jumped (+66%) in 2023 → Likely due to business registration, tax structuring & compliance setup.
Freelancers & Admin Support (+51% in 2024) → Business scaled operations and required more support staff.
Travel & Networking (+56% in 2024) → Investments in supplier relationships, conferences & industry expansion.
Office Expenses (+20% in 2024) → Likely due to workspace upgrades, software licenses, or additional tools.
Actionable Takeaways:
Are backend costs supporting revenue growth? If G&A scales faster than sales, rethink efficiency.
Outsource strategically. Freelancers are great for flexibility but can become a hidden cost if not managed well.
Use automation to reduce admin burden. Investing in software can lower long-term operational expenses.
Lesson: Backend Costs Should Scale Profitably!
📉 Spending too little = Stagnation & operational bottlenecks.
📈 Spending too much = Eating into profits & reducing scalability.
Owner Compensation & Profitability
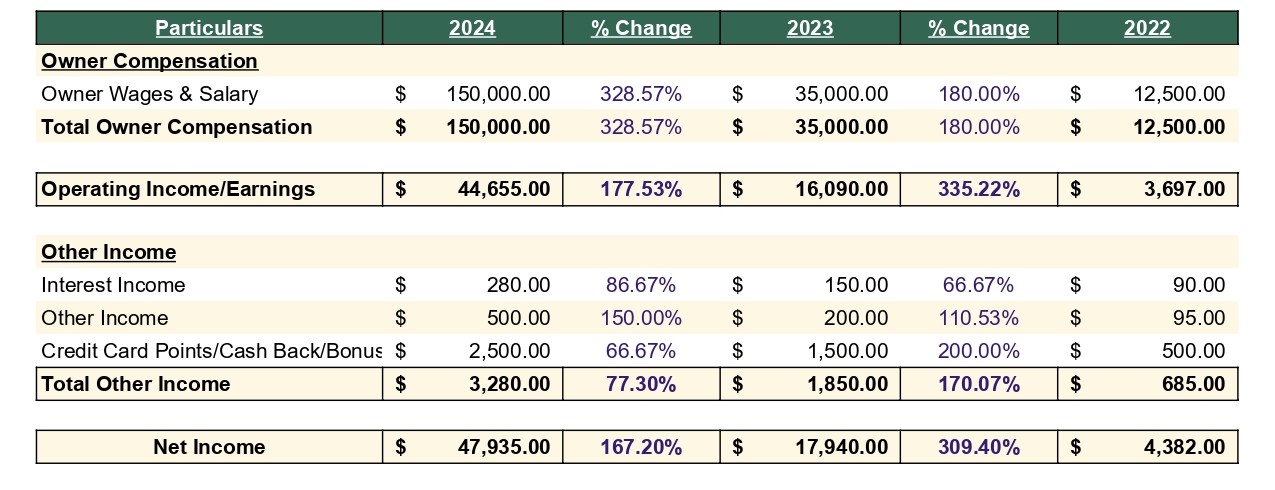
Owner Pay Increased Over 3 Years:
2022 → $12,500
2023 → $35,000 (+180%)
2024 → $150,000 (+328%)
Key Insights:
2022-2023: Low pay strategy—Reinvesting most profits back into the business for growth.
2024: Major salary increase—The owner starts taking structured pay as the business stabilizes.
Despite the higher salary, net income still grew healthily!
What This Means for E-Commerce Founders:
Profitability is strong enough to sustain both reinvestment & fair owner compensation.
Net Income Still Scaled:$4,382 (2022) → $17,940 (2023, +309%) → $47,935 (2024, +167%)
Smart financial planning ensures owners get paid while the business thrives.
Actionable Takeaways:
Prioritize reinvestment in the early years to sustain long-term growth.
Set a structured salary plan to avoid cash flow shocks when scaling compensation.
Ensure profitability remains intact even as owner pay increases—balance is key!
Lesson: Pay Yourself, But Sustainably!
📈 A well-managed e-commerce business should generate enough cash flow to pay its owners while still fueling growth.
Conclusion
Scaling an e-commerce brand isn’t just about selling more. It’s about understanding where your profit lives—and where it leaks.
This real-world SOPL breakdown shows that revenue can be deceiving, and without financial clarity, growth can actually hide major inefficiencies. But with a structured income statement, everything changes. You get visibility. You make smarter decisions. And you finally build a business that doesn’t just grow — it profits.
If you’re a founder who’s ready to clean up the chaos, understand your numbers, and scale profitably —
Let’s talk. I’ll walk you through exactly how to structure your SOPL and uncover what’s really going on in your business.